

This article describes a few simple ways to start an analytics plan.
Step 1: Map success measures to top-level goals
A problem well stated is a problem half solved.Charles Kettering, American inventor
It’s important to be clear with your goals and what you want to measure. If someone says they want to measure “collaboration”, “employee satisfaction”, or “communication”, I usually ask “And, what do you mean by that?”
I recommend brainstorming ideas with the portal team to come up with a draft list. For example for a portal intended to improve productivity and sharing, potential success measures could be:
- % of users sharing content, documents, or sites
- Frequency of document additions and edits
- Rate of users contributing to discussions
- Reduction of rework or time saved
- Decrease of internal email volume
At this point, you should have a list of possible measures or key performance indicators (KPIs). You may or may not be able to measure everything, that’s okay. The next step is to pair this top-down brainstorm with a bottom-up approach.
Step 2: Define meaningful KPIs
Look at your current or planned analytics package. What reports, metrics, or KPIs are available to you? Usually, there are standard reports like top search queries, top visited areas, top visitors, browsers, devices, etc.
Of course, you should keep your eye on basic usage data, but that’s not where the real insights lie. The question to ask when developing KPIs is: what will you do differently with that data? If nothing, than maybe you don’t need that report or measure.
Ideally measures should be: strategic to your organization or team, stated from the employee/customer perspective, and make performance obvious (good or bad).
Poor KPIs include:
- Visits or hits
- Page views
- Followers or likes
Better KPIs are:
- Visitor loyalty
- Task completion
- Adoption or engagement
This list is inspired by Avinash's post if you want to learn more.
Here are a few examples of measures that can provide insight, and help you evolve and improve your employee portal:
Visitor loyalty
Loyalty can be a useful measure for employee portals because if people are returning to the intranet, it's a good sign that it's useful. You measure loyalty by looking at the frequency and quality of visits. For example:
How many times a visitor returns in a week/month/quarter:
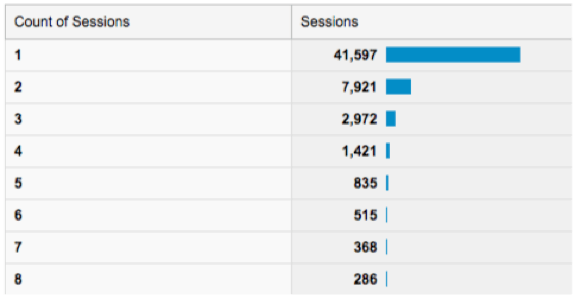
You want to have a target for this. For example, if you update news on the homepage three times a week, you could aim for three visits per week. In the example above, only about five per cent of visitors come back more than three times/week. This can trigger action, such as creating more engaging content, questioning why content is updated three times a week, and promoting the intranet more within the organization.
How long between visits:
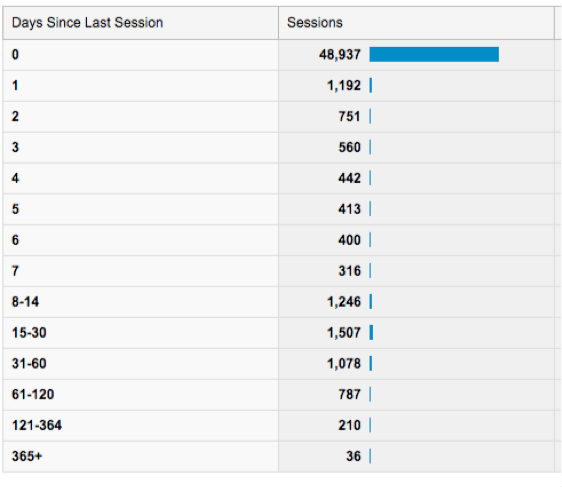
Similar to the previous report, this tells you information about the long-term relationship people have with the employee portal. If the days since last session is high or at zero, this tells you people are not coming back very often. Again, in this example above, there is a ton of room for improvement with visitor loyalty, and setting actionable targets as a first step may provide the focus needed for improvement.
How long people spend on the site:
If people are not spending much time on the portal, this might indicate it’s not a critical work tool, or important for people’s day-to-day tasks:
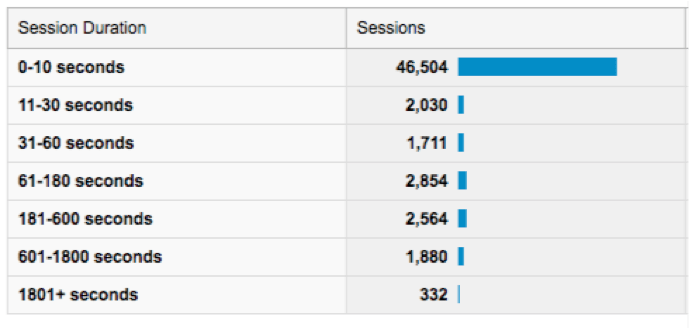
Every portal is different, but typically the majority of visits are between two to five minutes.
Tip: If the employee portal is the default homepage for people’s browsers, you should filter out any visits that are under one or two seconds. This might mean that people are opening their browser, but just intend to go somewhere else.
Engagement
Measuring engagement is vague, and it’s not always clear what good engagement looks like. It could be everything from measuring contributions, activity, to business impact or output. Examples might include:
- Recognition — how frequently are employees recognized for their contributions? Who are the top influencers in the organization?
- Growth and learning — how long does it take a new employee to get up to speed with collaborative tools? What is the frequency of questions being answered?
- Innovation — how long do ideas take to move forward? How many ideas or suggestions are being contributed?
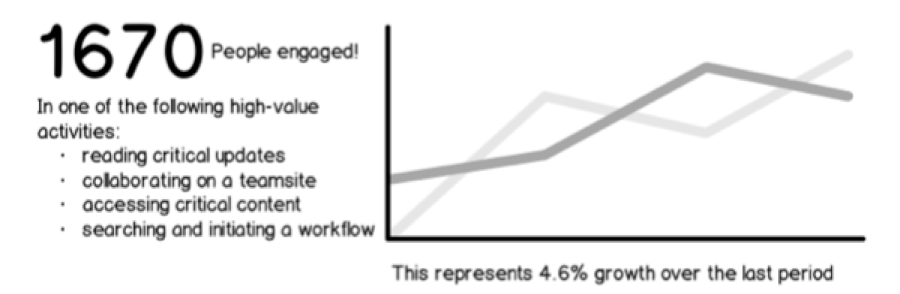
These are not always obvious with standard reports that you see in analytics packages, and may require some creative thought. One way to approach this to track activities that mean engagement, and summarize that in a KPI or measure such as this example below:
Another powerful tool which can help measure engagement, is Gooddata for Yammer. This example from one of the standard dashboards shows responses to threads:
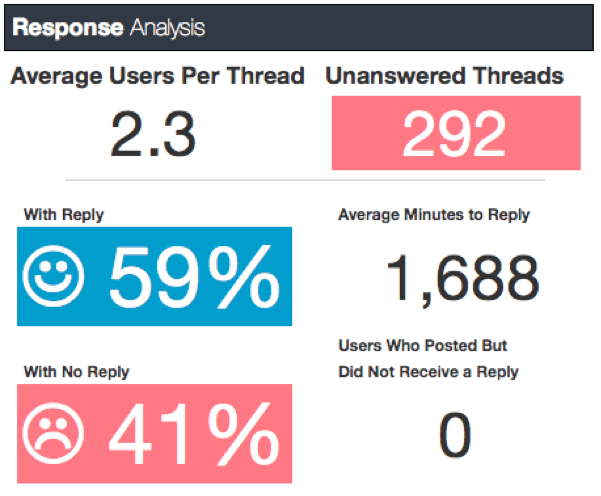
This report is showing a number of actionable measures: number of unanswered threads over a period of time, percent of threads without replies, and users who post but do not receive a reply. These indicators can tell you who might be less engaged with the Yammer network, and questions that might be out there that are not answered. Following up with these people and threads could help improve overall engagement.
There are many ways to approach analytics for intranets, and I hope this gives you some inspiration to get started!


