

After completing a project that uncovered ways to improve our onboarding process we realized we had to look beyond how someone starts a career with Habanero to the journey of learning, training, and feedback. Up until recently, we’ve called this process performance management.
We knew through employee surveys and anecdotal feedback that some parts of the performance management were working really well, while others just felt crummy. We wanted to understand the big picture to know that we were investing our time in solving the right problems.
So, we embarked on a short, time-boxed initiative to understand as much as we can about the current experience of performance management at Habanero.
Two weeks, two people, one mission
Our mission was to use experience design methodologies to uncover opportunities for change in how our employees experience Habanero through their career.
The ExD pop-up space is born
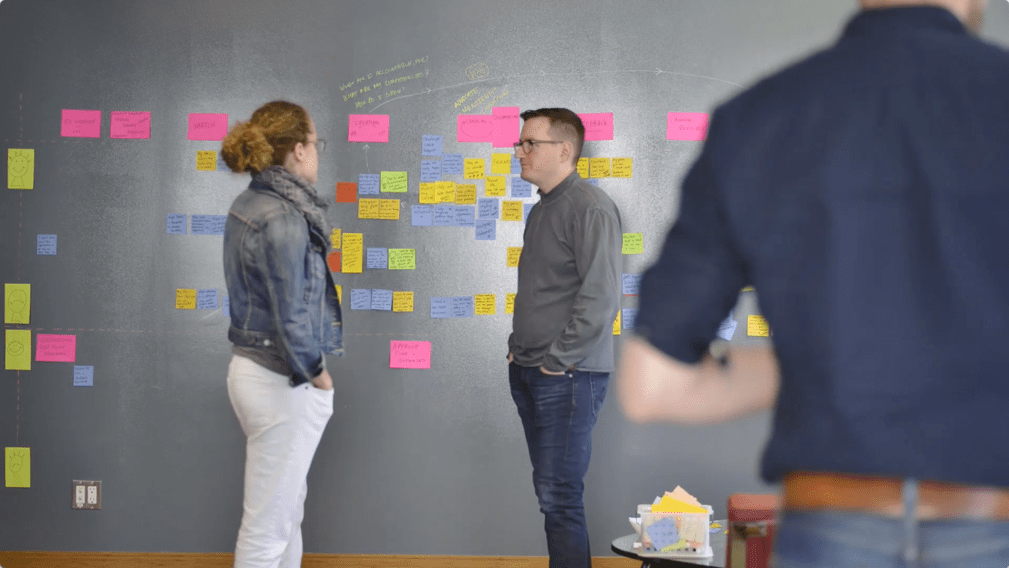
My colleague, Melanie Gabanna, and I were particularly sensitive to a magician act (disappearing for two weeks and coming up with a magical outcome). We saw this as an opportunity to start building the change momentum throughout using what we called 'kitchen collisions.’ Both of us are located in different offices, so we decided for the two week initiative we would set up a video camera connecting the two spaces in Calgary and Vancouver.
This was an opportunity to expose our findings throughout the process and gain further insight and feedback along the way. Setting up our spaces near the kitchen enabled us to do a bit more guerilla research, grabbing people for a quick informal conversation while they made coffee or ate lunch.
Higher altitude view and capturing insights
To better understand the process, we needed to gain insight from a variety of people who experience it every day. We knew we couldn't speak to everyone, so we combined 12 in-person interviews with an online survey to pull out initial insights.
We added insights from our interviews and survey responses according to where it fit along the process, how that experience felt, and from who's perspective (the performance managers vs other employees).
Initially this was just one journey map, but midway through we realized there were experiences unique to performance managers that deserved attention separate from an employee's experience. So, we split that out, pulling the blue stickies (insights from performance managers) into their own journey.
Creating a journey map
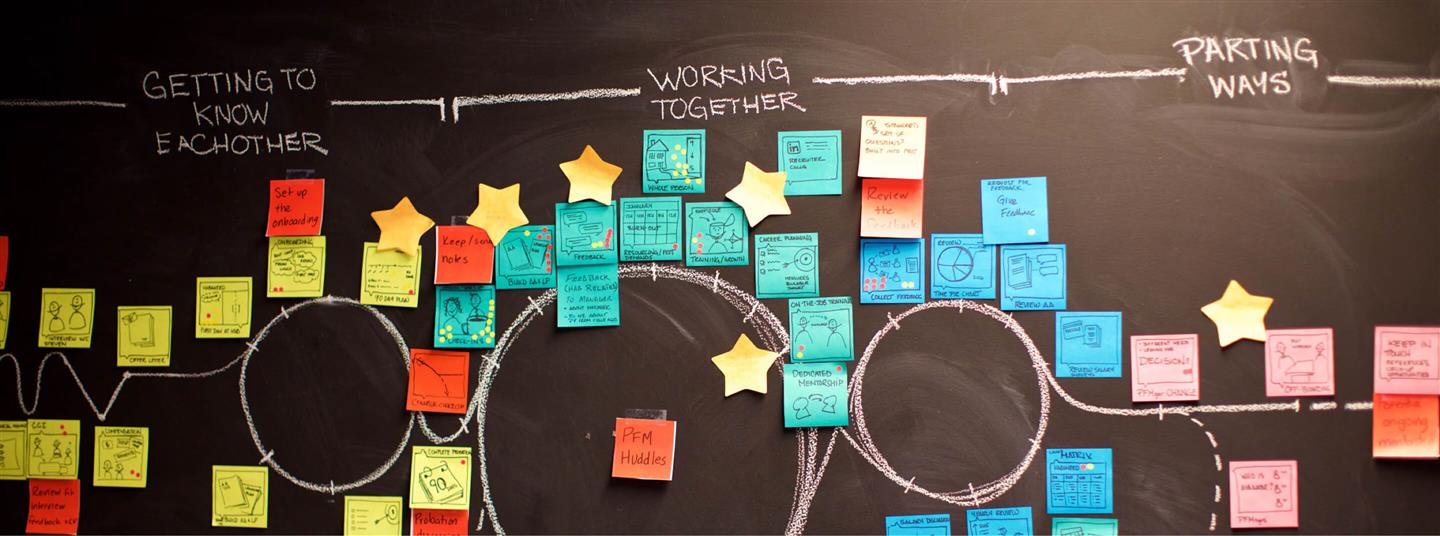
Journey maps often follow a specific sequence of activities. We quickly realized that much of the performance management journey didn't have a specific order to it. The onboarding and offboarding processes did, but what happened in the middle – check-ins, reviews, feedbacks sessions – didn't happen sequentially. By artificially putting it on a linear continuum, we were worried it would present “false cause and effect” connections. Mapping out a relationship linearly also felt weird and inauthentic.
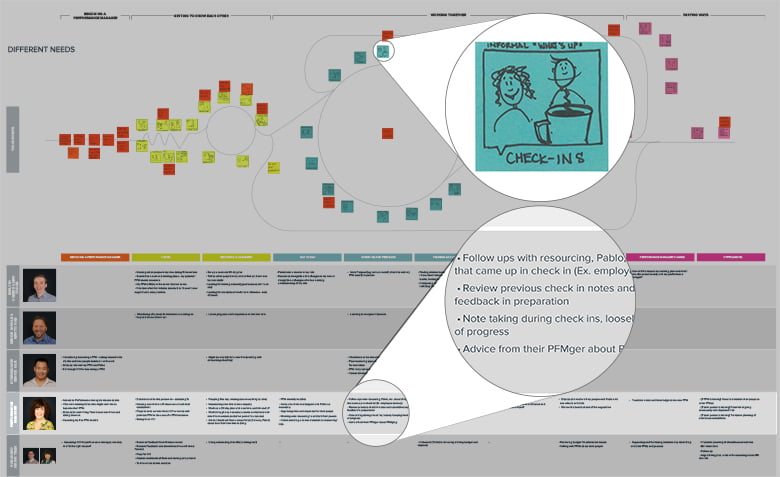
Touchpoints across the experience are contained in the top portion of the graph. Details about each touchpoint are indicated under the activities and thinking sections.
This lead us to three big phases:
- Getting to know each other (from initial interview through your first 90 days)
- Working together (our regular check-ins and rhythms, including our yearly review)
- Transitions and parting ways (career transitions and exit interviews, etc.)
The visual layout facilitated some deeper insight into what worked and what didn't as well as surface key cause and effect relationships. Adding that to what we learned in our interviews and conversations gave us a really complete picture of what was successful and what needed attention and smoothing out.
Digging into the details: Understanding the different journeys using empathy mapping
Different people have different experiences and needs. We had identified 3 key persona groups:
- New employee
- Intermediate to senior employee
- Performance manager
Using our initial research, we built out empathy maps for each of our persona groups to understand how each of them is thinking, feeling, hearing, seeing, and doing.
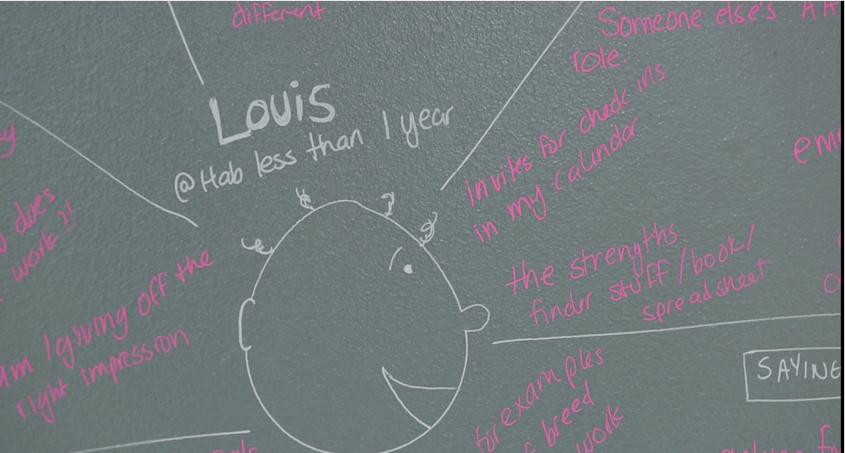
What we discovered as we chatted with folks coming in and out of our space was that we were missing one persona—a new hire, senior in their career versus our existing persona for a new hire who is junior in their career. These two people have very different needs, even though they are both new to Habanero. We also noted that we needed to understand the journey of someone who wants to become a performance manager.
Combining insight from journey map and personas together starts to build a picture of unique needs at different parts in the process.
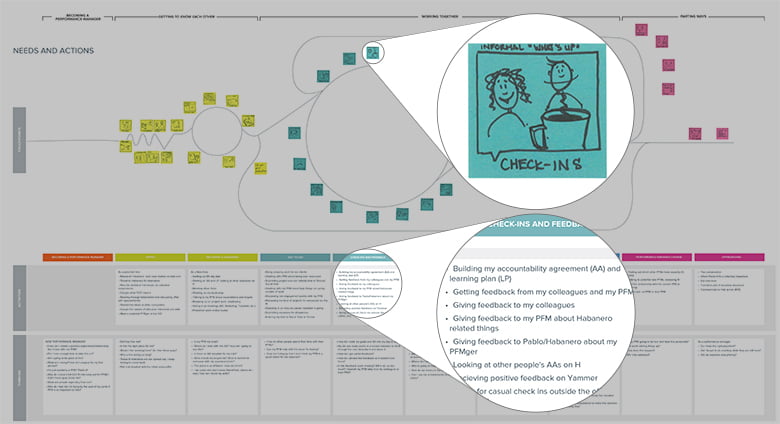
Journey map layered with persona insights.
Highlights and pain points
Workshops used to gather additional feedback and prioritize highlights and pain points.
Through a series of workshops across our offices, we used dot voting to collect prioritization feedback. This helped validate what we had heard, as well as provided additional insight and feedback.
For example, we heard a lot about salary discussions at the end of the year. But we also learned how some of the other aspects of performance management impact the salary discussion—such as our skills matrix, feedback, and something we call accountability agreements (basically a description of what you’re accountable for in our organization).
Focusing solely on the salary discussion misses a whole part of the process that has a huge effect on that discussion. Being able to see all aspects of the process in one diagram made it easier to have discussion and make connections and linkages between activities.
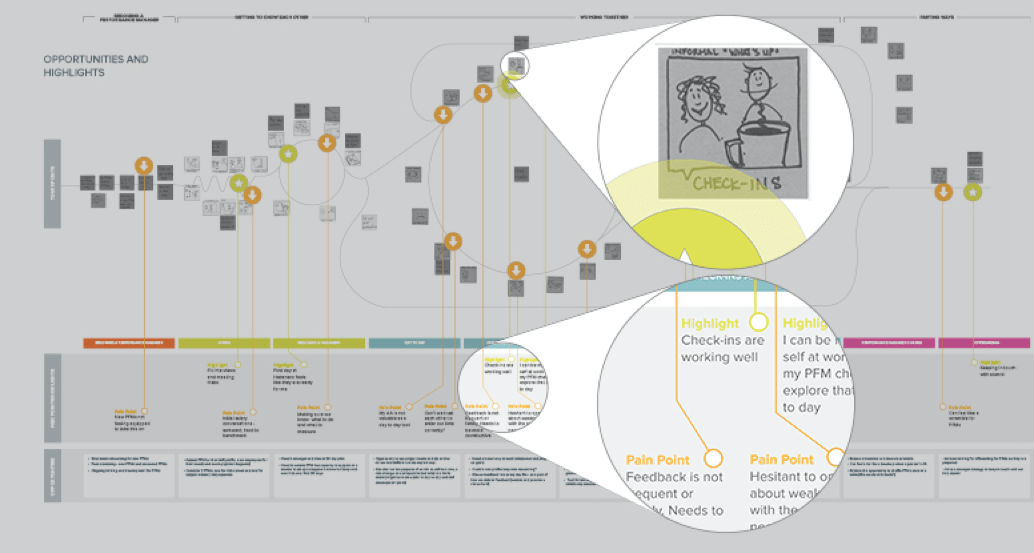
Inspired by Adaptive Path’s Exploratrium experience design work we used visuals to indicate the highlights (green stars) and painpoints (orange downward arrows).
Outcomes
At the end of two weeks we had clarity around the process of performance management, we could make decisions from a point of knowledge and understanding about relationships and connections.
- We have insight into priorities
- We have a plan for our next steps (priority list)
- We have buy in for next steps
Some key things that contributed to success:
- Autonomy and the ability to stretch and take risks as a team
- Access to our employees, people giving their time
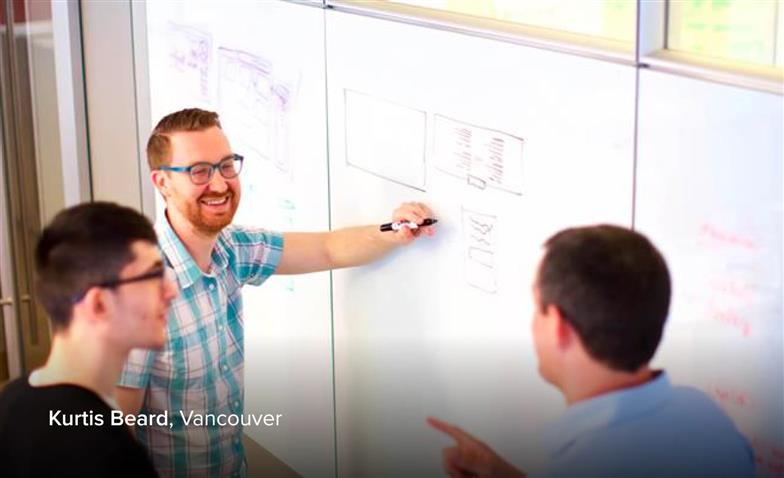
- A space to work in that has high visibility
Next steps
We will be making incremental changes to our organization instead of a big overhaul, smoothing out the experience one area at a time to see how that impacts other areas while continuously reprioritizing. Design principles developed during the project will help guide the changes we make to focus on a shared vision for the future experience.


